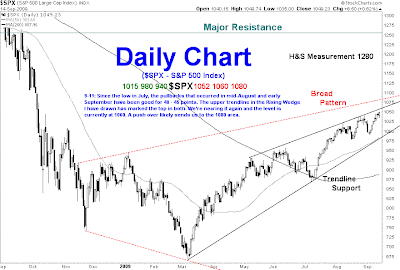
Index Charts S&P 500 Index ($SPX) -- We are nearing the upper trendline in the Wedge on the Daily Chart . It's managed to hold the price down for the past couple of months. A push over suggests a move to the 1080 area. On the Weekly Chart , we are very close to important intermediate term resistance levels. I think a sustained push over in the short term is unlikely to occur. If a pullback does occur in the next day or three, I'll keep this Chart overhead. Nasdaq 100 Index ($NDX) -- I'm struggling to find much to draw on the Daily Chart . I've included a possible mini Broad Pattern, but it's not going to require much of an effort to negate it. On the Weekly Chart , it easily knifed through an area where I felt it would struggle at. However, it's sometimes common to "temporarily" punch over before reversing. Russell 2000 Index ($RUT) -- On the Weekly Chart , the key areas of resistance are 620 and 665. I expect it reach either one or both by the...

