Posts

Showing posts from May, 2008

Actionable Setups 5-28-08

Image

Points of Interest 5-27-08

Image
S&P 500 (S) 1370 & 1365 ~~ (R) 1405 & 1425 Dow Industrials (S) 12,450 & 12,300 ~~ (R) 12,650 & 13,000 Nasdaq 100 (S) 1940 & 1885 ~~ (R) 1980 & 2016

Points of Interest 5-23-08

Image
S&P 500 (S) 1388 & 1378 ~~ (R) 1415 & 1427 Dow Industrials (S) 12,570 & 12,480 ~~ (R) 12,670 & 13,000 Nasdaq 100 (S) 1950 & 1933 ~~ (R) 2000 & 2050

Points of Interest 5-21-08

Image
S&P 500 (S) 1407 & 1380 ~~ (R) 1428 & 1448 Dow Industrials (S) 12,700 & 12,625 ~~ (R) 13,010 & 13,245 Nasdaq 100 (S) 1980 & 1945 ~~ (R) 2052 & 2060 The "Points of Interest" values are key Support / Resistance areas via the daily charts. I still think it's probable that the market will make an attempt for higher levels so take profits and/or adjust stops to ensure profitable trades.

Actionable Setups 5-21-08 (Longs)

Image

Updated Setups 5-21-08 (Longs)

Image

Updated Setups 5-21-08 (Shorts)

Image

Points of Interest 5-19-08

Image
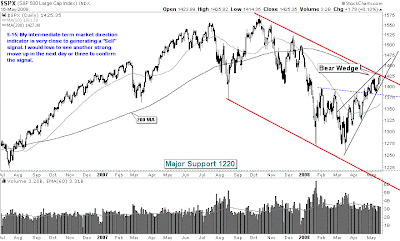
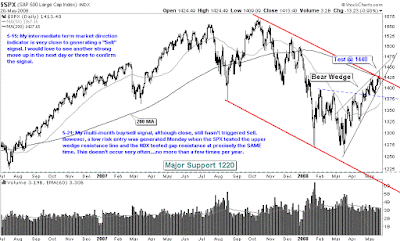
S&P 500 (S) 1411 & 1380 ~~ (R) 1430 & 1450 Dow Industrials (S) 12,840 & 12,700 ~~ (R) 13,015 & 13,240 Nasdaq 100 (S) 1998 & 1943 ~~ (R) 2052 & 2065 It's still going to take another move up before my market direction indicator provides a "Low Risk" Sell Signal. Typically, the signal will last for 2 - 4 months before it changes. As I've mentioned before, market calls will continue to be easier to make than individual stock calls. When you trade the market, you reduce your risk 20% since 20% of a stocks movement comes from the stock itself, while the other 80% comes from the market. By trading the market, you take the 20% stock movement out of the risk equation. To keep things really simple, I would suggest trading the holders (i.e. QQQQ,. QID, SPY, SMH, DIA, BBH, etc.), which allow you to trade individual sectors. It's not going to give you as much action, but it will allow you to fine tune your skills to the point where you feel VERY

Actionable Setups 5-19-08 (Longs - Page 2)

Image