Posts

Showing posts from November, 2008

Spreadsheet for December 1, 2008

I've created a spreadsheet for the Short & Breakout Setups. Since I post so many, I thought it might be helpful to share a condensed watch list with the key technical values. It's important to realize that many of the technical levels change on a day to day basis so you still have to keep a chart overhead. I'll improve it over the next couple of weeks. If anyone has any other ideas, send me an email. Link

Thoughts....

Once again, I've posted a lot of setups to ponder over before Monday. There seems to be some confusion how I trade the short setups. I use two methods when I short. First, I just go in at the level I'm interested in and slap a stop on it that fits my personal trading style. Or, I'll time my entry using the 60 minute chart. I'll wait for a lower high and go in once the most recent lows are broken on that chart. I'll use those highs as my stop. Here are a couple of chart examples that I hope clear any questions: Chart #1 - MTL (Daily Chart) Chart #2 - MTL (60 Minute Chart)

Index Watch for December 1, 2008

Image

Review for Week of December 1, 2008

Intraday Setups (Click on Symbol for Annotated Chart) IWM Russell 2000 iShares IAI U.S. Broker-Dealers iShares SKF UltraShort Financials MZZ UltraShort Mid Cap 400 Short Setups (Click on Symbol for Annotated Chart) IAU COMEX Gold Trust iShares ABMD Abiomed AFAM Almost Family OCN Ocwen Financial ORH Odyssey RE Holdings CUB Cubic Corp WWE World Wrestling Entertainment IDCC InterDigital CMP Compass Minerals HK Petrohawk Energy NLY Annaly Capital MPR Met-Pro TKC Turkcell UPS UPS PETS PetMed Express HMSY Health Management Systems RGLD Royal Gold SKT Tanger Factory Outlets APOL Apollo Group MHS Medco Health Solutions MLM Martin Marietta Materials MMP Magellan Midstream Partners ASTE Astec Industries AIT Applied Industrial Tech ARJ Arch Chemicals AXYS Axys Technologies DNB Dun & Bradstreet DW Drew Industries FSYS Fuel Systems Solutions GEO GEO Group MTD Mettler Toledo NAFC Nash-Finch ESI ITT Educational Services KAMN Kaman ALGT Allegiant Travel A...

Thoughts....

I posted a few long and short setups worth watching over the next day or so. It's always difficult to know whats going to occur during a holiday week, but I still think there are opportunities to make a few cheap trades. I'd personally prefer the drift up to continue because it'll provide us with more shorting opportunities.

Index Watch for November 28, 2008

Image

New Setups for November 28, 2008

Short Setups (Click on Symbol for Annotated Chart) IAU iShares COMEX Gold Trust ORH Odyssey RE Holdings OCN Ocwen Financial MLM Martin Marietta Materials SKT Tanger Factory Outlet Centers NLY Annaly Capital Management MPR Met-Pro IDCC InterDigital MHS Medco Health Solutions ESI ITT Educational Services SHY 1-3 Year T-Bond Fund iShares Long Setups (Click on Symbol for Annotated Chart) TCK Teck Cominco AHD Atlas Pipeline PPO Polypore Intl XRM Xerium Tech HIG Hartford Financial TAM TAM S.A. KFN KKR Financial HTCH Hutchinson Technology CBL CBL & Associates PLD Prologis Trust TRW TRW Automotive BKD Brookdale Senior Living

Education - Inside Stick Scan

This is a real simple scan that I don't take advantage of as often as I should. When I get burned out or bored with the market, I'll trade a "Inside Stick" setup. They are similar to the "Bounce Scan" in that I want the price to be "stretched" from the 50 Day MA. If it works, it'll have some room to run. I trade them long and short, and I consider them short term in nature 95% of the time. It's also important for the days range in the third stick to be narrow, which holds the risk to a minimum. [type = stock] and [country = us] and [daily sma(20,daily volume) > 100000] and [daily close >= 1] and [daily close = yesterday's daily high] and [yesterday's daily high >= daily high] and [2 days ago daily low Example #1 Example #2

Thoughts....

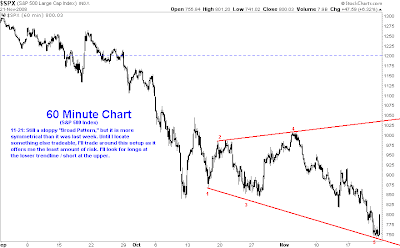
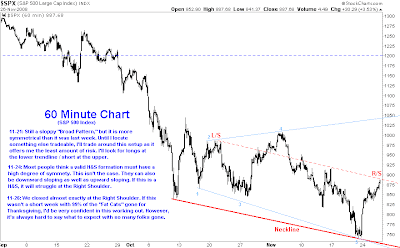
I posted a few aggressive and short term long setups to keep an eye on as well as an alternate scenario to the "Broad Pattern" I posted over the weekend regarding the 60 minute charts. I also posted a scan with a couple of examples I use at Stockcharts.com. I'll provide a link to it from the home page during the week with some different variations to it.

Index Watch for November 25, 2008

Image

New Setups for November 25, 2008

Image

Education - Short Term Long Scan

I use this scan to find short term long trade setups. It works well once the market consolidates for 2 - 4 days after falling sharply over a period of weeks. Although I run it daily, it has historically produced a multiple of candidates only a few times over the course of a year. When I scroll through the charts, I look for stocks where the price action is "stretched" from the 50 Day Moving Average. Also, I want the 8 Day Moving Average to be "curling up" and under the closing price. The scan with examples: Scan #1 [type = stock] and [daily sma(20,daily volume) > 100000] and [daily sma(60,daily close) > 1] and [daily close >= yesterday's daily close] and [daily close >= daily sma(8,daily close)] and [daily close Example #1 Example #2 Scan #2 [type = stock] and [daily sma(20,daily volume) > 75000] and [daily sma(60,daily close) > 1] and [daily close = daily sma(8,daily close)] Scan #3 [type = stock] and [daily sma(20,daily volume) > 100000] ...

Thoughts....

The recent action in the market isn't providing me with many new and objective setups to post. When it does, I'll get them up as quick as I can. With the 2002 lows now being taken out, the next area of significance to keep an eye for the S&P 500 is 650. This is illustrated on the monthly chart in the "Index Watch" by a trendline that extends to 1982. Another chart that interests me in the same section is the monthly chart of the U.S. Dollar. As it approaches the Right Shoulder in the massive Head & Shoulders pattern, it's possible this phase of the greenback rally may be nearing an end, which gives me a little hope for the market. I'm going to post some of my scans during the week with examples.

Index Watch for November 24, 2008

Image

Review for Week of November 24, 2008

Intraday Setups (Click on Symbol for Annotated Chart) DUG UltraShort Oil & Gas SDS UltraShort S&P 500 MVV Ultra MidCap 400 UNG U.S. Natural Gas Fund DBA PowerShares Agriculture TWM UltraShort Russell 2000 SMN UltraShort Basic Materials SRS UltraShort Real Estate DXD UltraShort Dow 30 SDP UltraShort Utilities FXY CurrencyShares Japanese Yen GLD streetTRACKS Gold Trust EEM iShares Emerging Markets Short Setups (Click on Symbol for Annotated Chart) BMS Bemis CASY Casey's General Stores PETS PetMed Express RGLD Royal Gold SMG Scotts Co TEVA Teva Pharma ALGT Allegiant Travel ICFI ICF International EPIQ Epiq Systems HMSY Health Management Systems CPSI Computer Programs & Systems SPTN Spartan Stores SRCL Stericycle GENZ Genzyme GILD Gilead Sciences CHD Church & Dwight LNT Alliant Energy ATO Atmos Energy WEC Wisconsin Energy XEL Xcel Energy XOM Exxon Mobil EW Edwards LifeSciences AOC Aon Corp LMNX Luminex GHDX Genomic Health LH Laborat...

Thoughts....

I didn't need to, but I posted a few more aggressive setups that are at or near actionable levels. If discipline is maintained, they all offer minimal risk. Although it feels like the bottom is going to fall out any moment, I don't have a clue where we're headed over the short term. There's no point in trying to predict the bottom because it's an impossible task. Until things clear up, I'm going to poke along and control my positions by following the rules that help me survive. My trades will continue to be around key and objective S/R levels.

New Setups for November 18, 2008

Image