Posts

Thoughts....

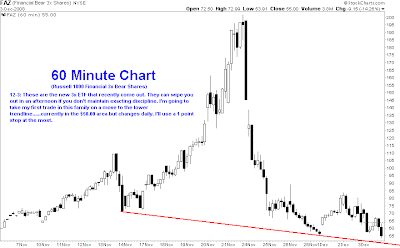
I've never understood why traders feel the need to make predictions. Trading based on predictions (e.g. hope) is a fool's game and impairs our ability to make clear and objective decisions. In my opinion, they should be based on what is seen. Once you understand what you see, it's possible to make the decisions that lead to being a succesfull and profitable trader. In my opinion, there are still too many charts clinging for dear life to say the bottom is. A final wash-out will take everything down, and that hasn't occurred yet. Unfortunately, it's impossible to say where we're headed over the short term. I've posted some key levels I'm watching on the S&P 500 chart below that will be my guide over the next week. I've also included a spread sheet listing the key technical levels for the Short & Breakout Setups. SpreadSheet
Index Watch for December 8, 2008

Image

Review for Week of December 8, 2008

Intraday Setups (Click on Symbol for Annotated Chart) PSQ Short QQQ ProShares FXP UltraShort China UUP U.S. Dollar PowerShares FXE Currency Shares Euro Trust FXY Currency Shares Japanese Yen MZZ UltraShort MidCap 400 Breakout Setups (Click on Symbol for Annotated Chart) DCM NTT DoCoMo SXCI SXC Health Solutions ASH Ashland DIOD Diodes OXM Oxford Industries DRYS Dry Ships ENG ENGlobal DPZ Domino's Pizza LVS Las Vegas Sands LSE CapLease NNBR NN, Inc PHIIK Petroleum Helicopters PLD Prologis Trust TBSI TBSI International TNL Technitrol TPGI Thomas Properties NSIT Insight Enterprises NSTC Ness Technologies AHII Animal Health International ENTG Entegris DDR Developers Diversified RE BRKR Bruker HDNG Hardinge ID L-1 Identity Solutions IO ION Geophysical KFN KKR Financial SPIR Spire SRZ Sunrise Senior Living LIZ Liz Claiborne BEE Strategic Hotel & Resorts STX Seagate Technology CPY CPI Corp TRMA Trico Marine CTCM CTC Media AVNX Avanex CNTF China...

Thoughts....

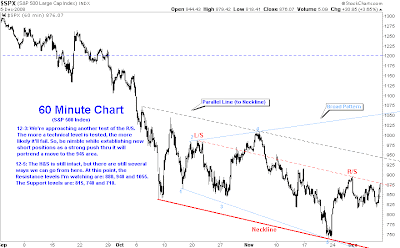
As indicated on the S&P 60 minute chart, I see several patterns.....a Head & Shoulders Pattern, a Broad Pattern, Parallel Lines, and an Inverted Head & Shoulders that isn't marked so it's clear I'm confused. The Sentiment Indicator I use also indicates indecision. Until the picture clears, I'll take a real simple approach. I'm going to trade around key S/R levels on the 60 minute chart. In other words, I'll short objective resistance levels and scale out of longs. If those resistance levels are broken, I'll get out of shorts and look at the Bounce Setups for entries. If the market goes the other way, I'll be a buyer at objective support levels and I'll scale out of shorts. I realize that's wordy but it really is simple. Remember, if you want to be a pro, you have to trade a pro. You buy support....you short resistance. If those levels are taken out, you get out with a minimal loss. I added a few setups to keep an eye that weren't ...

Index Watch for December 4, 2008

Image

New Setups for December 4, 2008

Image

Spreadsheet for December 1, 2008

I've created a spreadsheet for the Short & Breakout Setups. Since I post so many, I thought it might be helpful to share a condensed watch list with the key technical values. It's important to realize that many of the technical levels change on a day to day basis so you still have to keep a chart overhead. I'll improve it over the next couple of weeks. If anyone has any other ideas, send me an email. Link

Thoughts....

Once again, I've posted a lot of setups to ponder over before Monday. There seems to be some confusion how I trade the short setups. I use two methods when I short. First, I just go in at the level I'm interested in and slap a stop on it that fits my personal trading style. Or, I'll time my entry using the 60 minute chart. I'll wait for a lower high and go in once the most recent lows are broken on that chart. I'll use those highs as my stop. Here are a couple of chart examples that I hope clear any questions: Chart #1 - MTL (Daily Chart) Chart #2 - MTL (60 Minute Chart)

Index Watch for December 1, 2008

Image

Review for Week of December 1, 2008

Intraday Setups (Click on Symbol for Annotated Chart) IWM Russell 2000 iShares IAI U.S. Broker-Dealers iShares SKF UltraShort Financials MZZ UltraShort Mid Cap 400 Short Setups (Click on Symbol for Annotated Chart) IAU COMEX Gold Trust iShares ABMD Abiomed AFAM Almost Family OCN Ocwen Financial ORH Odyssey RE Holdings CUB Cubic Corp WWE World Wrestling Entertainment IDCC InterDigital CMP Compass Minerals HK Petrohawk Energy NLY Annaly Capital MPR Met-Pro TKC Turkcell UPS UPS PETS PetMed Express HMSY Health Management Systems RGLD Royal Gold SKT Tanger Factory Outlets APOL Apollo Group MHS Medco Health Solutions MLM Martin Marietta Materials MMP Magellan Midstream Partners ASTE Astec Industries AIT Applied Industrial Tech ARJ Arch Chemicals AXYS Axys Technologies DNB Dun & Bradstreet DW Drew Industries FSYS Fuel Systems Solutions GEO GEO Group MTD Mettler Toledo NAFC Nash-Finch ESI ITT Educational Services KAMN Kaman ALGT Allegiant Travel A...