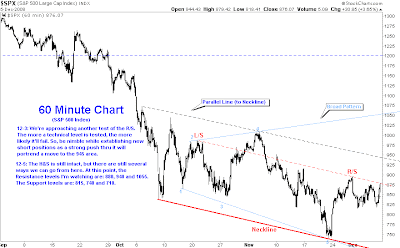
Review for Week of October 26, 2009:
Breakout Setups (Click on Symbol for Annotated Chart) AHD Atlas Pipeline Holdings NYX NYSE Euronext JEC Jacobs Engineering SUNV Sunovia Energy APL Atlas Pipeline Partners VM Virgin Mobile XTXI Crosstex Energy CEP Constellation Energy DRYS Dry Ships SGMS Scientific Games SIMO Silcon Motion IO ION Geophysical HERO Hercules Offshore ERES eResearch Technology LOPE Grand Canyon Education SB Safe Bulkers SKIL SkillSoft PNSN Penson Worldwide CENX Century Aluminum PCX Patriot Coal TESO Tesco TWI Titan Intl EXM Excel Maritime Carriers FLOW Flow Intl PRGN Paragon Shipping CFX Colfax QRCP Quest Resource SD Sandridge Energy TBSI TBSI Intl QMM Quaterra Resources ACAS American Capital KHD KHD Humboldt Wedag AKRX Akorn PRXI Premier Exhibitions OME Omega Protein GMXR GMX Resources DMAN DemandTec CDII China Direct Industries LYG Lloyds Group HALO Halozyme Therapeutics IMN Imation KDE 4Kids Entertainment ULTR Ultrapetrol URRE Uranium Resources PEIX Pacific Et...


Comments
I see that crude oil won't break the support as of now, as MACD is signaling a Positive divergence on daily charts
Can you also post USD chart from 1950 or which ever first date data you have!?
Thanks. There has to be a bottom somewhere.
I'll have to look elsewhere for a longer term chart of the USD. I used all the data Stockcharts.com had. I'll see what I can come up....nice request.
Regards,
Tony